Blood Sugar Patterns Across Your Menstrual Cycle
Your glucose baseline doesn't stay flat all month, even on the exact same diet. A continuous glucose monitor study found a real biphasic pattern: lower in the late-follicular phase, higher in the luteal phase. Here's what the study measured, why researchers think it happens, and what it doesn't mean.
Quick Answer: Does Blood Sugar Change With Your Cycle?
A 2023 study using continuous glucose monitors (CGM) on 49 non-diabetic women found blood sugar follows a biphasic pattern across the menstrual cycle. Glucose runs lowest in the late-follicular phase, climbs through ovulation, and peaks during the luteal phase.[1] The likely driver is progesterone. As it rises after ovulation, insulin sensitivity appears to drop a bit, so cells take up glucose slightly less efficiently for the same input.[2][3]
This is population-level research on healthy, non-diabetic participants. It doesn't tell you what your own glucose reading means, and it's not a reason to change how you eat or manage insulin. The sections below cover what the study actually measured, and just as importantly, what it doesn't.
Educational content about published research, not medical advice. This is not diabetes-management guidance. For questions about your own glucose readings, talk to your doctor.
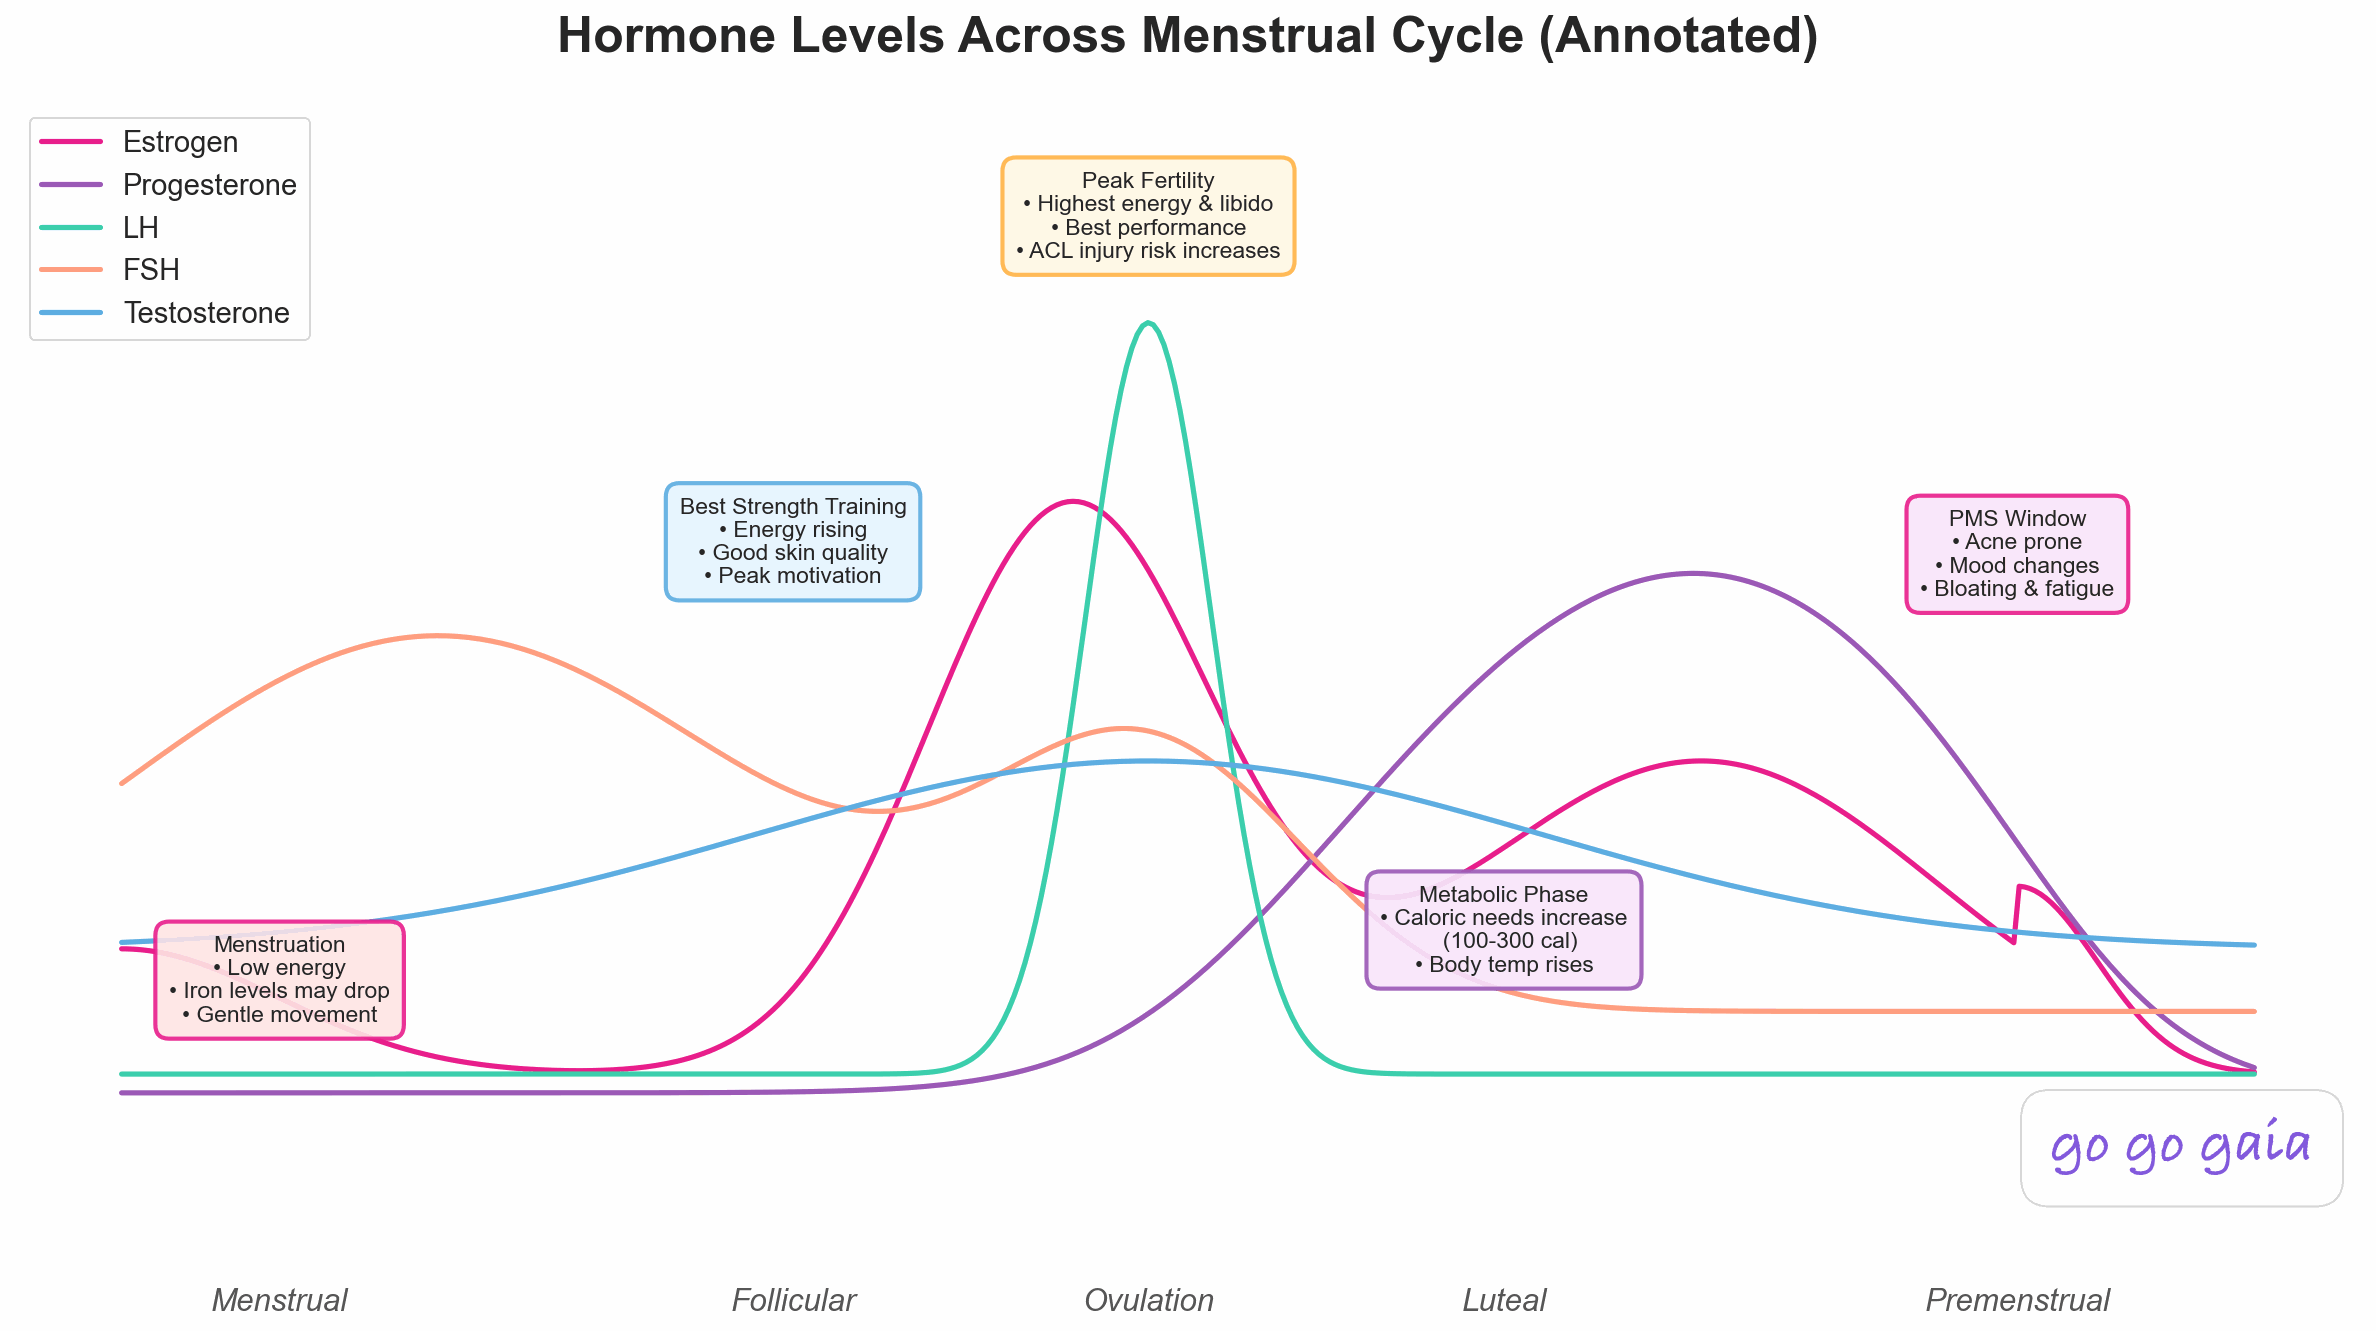
The progesterone rise after ovulation is the hormonal driver behind the glucose shift covered below.
Open a CGM app and you'll watch your blood sugar move all day with meals, sleep, and activity. What's less obvious is that the whole baseline drifts over the course of a month, even when your diet and exercise stay the same.
A 2023 study put that drift under a microscope. Researchers had 49 people wear a Dexcom G6 sensor for an average of 79 days each while they logged their cycles and tracked hormone data. Then the team compared glucose across 149 full menstrual cycles.[1] What they found lines up with older lab research on insulin sensitivity, and it gives a name to something plenty of CGM users have already noticed: a stretch of days where the numbers just run a little higher, for no obvious reason.
This page covers what that study measured, why researchers think it happens, and what it doesn't mean. It isn't about managing your blood sugar or interpreting your own CGM data. It's about a population-level pattern in the research.
The Study: A Biphasic Pattern in Non-Diabetic Glucose Data
The 49 participants were non-diabetic and between 18 and 30 years old. Each wore a Dexcom G6 continuously, which gave researchers a dense, day-by-day glucose record instead of a handful of scattered blood draws, the method most earlier studies relied on.[1]
Across those 149 cycles, daily median glucose formed a clear two-phase pattern. It was lowest in the late-follicular phase, at 5.8 ± 0.7 mmol/L, then rose through ovulation and peaked in the luteal phase, at 6.1 ± 0.8 mmol/L.[1] The gap is small, about 0.3 mmol/L (roughly 5 mg/dL) on average. But it showed up consistently enough across hundreds of cycles that the researchers described it as a genuine biphasic pattern, not statistical noise.
The study also found that higher estrogen tracked with lower glucose, which fits the shape of the curve. Estrogen dominates the follicular phase. Progesterone takes over after ovulation. That handoff is where the glucose pattern turns.
Earlier research on this topic used a handful of blood draws per cycle and came back inconsistent, sometimes finding a pattern and sometimes not. A CGM that samples every five minutes for months gave researchers something those older studies never had: enough data to see the shape clearly instead of guessing at it from a few timepoints.
Why It Happens: Falling Insulin Sensitivity as Progesterone Rises
The leading explanation ties back to a hormone shift that's well documented outside of glucose research too. After ovulation, progesterone rises sharply as the corpus luteum forms, and it stays elevated through the luteal phase. For the fuller picture of how estrogen, progesterone, and LH move across a cycle, see our guide to the hormone curve.
Progesterone appears to reduce insulin sensitivity somewhat, meaning cells respond to insulin a bit less efficiently and take up glucose a little more slowly. Estrogen works the other way, supporting glucose tolerance and insulin sensitivity. When estrogen dominates in the follicular phase, glucose runs lower. When progesterone takes over in the luteal phase, it runs higher.[3]
One of the clearest looks at this comes from the BioCycle Study, which followed 257 healthy women, ages 18 to 44, across full menstrual cycles and measured insulin resistance directly using HOMA-IR, a standard lab estimate built from fasting glucose and insulin. HOMA-IR rose from 1.35 in the midfollicular phase to 1.59 in the early luteal phase, then eased slightly to 1.55 later in the luteal phase. Both estradiol and progesterone were positively associated with that rise.[2]
Two studies, same shape. The CGM data shows what actually happens to glucose day to day. The lab-based HOMA-IR data shows a plausible reason why: insulin sensitivity moving in step with progesterone. Neither study on its own proves the mechanism, but together they tell a consistent story.
What This Research Doesn't Say
A few limits are worth being upfront about. The CGM study had 49 participants, all non-diabetic and between 18 and 30. That's a detailed dataset, but it isn't large or diverse enough to say exactly how big this shift is for every person, or whether it holds the same way in people managing diabetes, PCOS, or other conditions that already affect glucose.
The research also describes a population average, not a diagnosis or a personal reading. A 0.3 mmol/L shift in a study average says nothing about what any single glucose number on any single day means for you specifically. This page reports what researchers found across groups of people. It isn't a guide to reading your own CGM data, and it isn't diet or insulin-management advice.
If you track glucose for a medical reason, that conversation belongs with your doctor or endocrinologist, not a blog post.
Seeing Glucose Data Alongside Your Cycle
If you already wear a Dexcom, Libre, or Ultrahuman sensor, that data doesn't have to live in a separate app from your cycle tracking. A tracking app like Veya can pull in CGM data automatically and log it next to your cycle day, sleep, and symptoms, the same way it already handles wearable temperature and heart rate data.
The app displays that glucose data over time. It doesn't interpret your readings or suggest what to do about them, and it isn't a substitute for the tools and guidance your doctor gives you if you're actively managing blood sugar.
The Short Version
- A 2023 CGM study of 49 non-diabetic women found blood sugar runs lowest in the late-follicular phase and peaks in the luteal phase.
- The shift is small, about 0.3 mmol/L on average, but it showed up consistently across 149 cycles.
- The likely driver is progesterone, which appears to reduce insulin sensitivity somewhat as it rises after ovulation.
- Estrogen works the other direction, supporting insulin sensitivity in the follicular phase.
- This is a population pattern, not a personal reading, and it isn't diet or insulin-management advice.
None of this changes what a single glucose reading means on any given day. What it does is explain why a monthly baseline can drift a bit even when nothing else in your routine has changed.
Frequently Asked Questions
Educational information based on published sources. Not medical advice. For personal concerns, please consult your doctor.
Does blood sugar really change during your period?
Research suggests it does, at the population level. A 2023 study using continuous glucose monitors found blood sugar runs lower in the late-follicular phase and higher in the luteal phase, the week or so before your period. The average difference was modest, about 0.3 mmol/L (5 mg/dL), but it showed up consistently across the 149 cycles researchers tracked.
Why does glucose rise in the luteal phase?
The leading explanation is a drop in insulin sensitivity as progesterone rises. Progesterone increases sharply after ovulation and appears to make cells respond to insulin a bit less efficiently, so glucose clears a little more slowly for the same input. Estrogen has the opposite effect, supporting insulin sensitivity, which is part of why the follicular phase runs lower.
Does this apply to people with diabetes or PCOS?
The CGM study specifically enrolled non-diabetic participants, so it doesn't directly answer that question. Conditions like diabetes and PCOS already affect glucose and insulin sensitivity, and the interaction with cycle phase may look different. That's a question for your doctor, not something this research settles.
How big is the glucose shift, really?
In the CGM study, daily median glucose averaged 5.8 ± 0.7 mmol/L in the late-follicular phase and 6.1 ± 0.8 mmol/L in the luteal phase. That's a small average difference, well within a normal, non-diabetic range. It's a population pattern, not a threshold or a warning sign.
What is HOMA-IR, and how does it relate to this?
HOMA-IR is a standard lab estimate of insulin resistance, calculated from fasting glucose and insulin levels. The BioCycle Study measured it across full cycles in 257 women and found it rose from 1.35 in the midfollicular phase to 1.59 in the early luteal phase, tracking with the rise in estradiol and progesterone. It's one of the main pieces of lab evidence behind the insulin-sensitivity explanation.
Does Veya track glucose data?
Yes. The app can pull in glucose data automatically from Dexcom, Libre, and Ultrahuman sensors, alongside your cycle, sleep, and symptom logs. It displays that data over time. It doesn't interpret your readings or offer diabetes-management guidance. Glucose sits alongside lab and bloodwork import in our PCOS tracking features, since insulin resistance is common with PCOS.
Should I change my diet based on this pattern?
No, and that's not what this research is about. The studies here describe a population-level pattern in glucose and insulin sensitivity across the cycle. They don't provide dietary or insulin-management guidance, and neither does this article. If you have questions about your own glucose readings or how to manage them, talk to your doctor or a registered dietitian.
Your CGM already has this data. Your cycle log usually doesn't.
Pairing glucose readings with your cycle day is the only way to see whether your own baseline moves anything like the population pattern above.
See Your Glucose Data Next to Your CycleMost people connect their CGM and see a full cycle of paired data within about four weeks.
References
- Lin G, Siddiqui R, Lin Z, Blodgett JM, Patel SN, Truong KN, Mariakakis A. Blood glucose variance measured by continuous glucose monitors across the menstrual cycle. NPJ Digit Med. 2023;6(1):140. doi:10.1038/s41746-023-00884-x
- Yeung EH, Zhang C, Mumford SL, et al. Longitudinal Study of Insulin Resistance and Sex Hormones over the Menstrual Cycle: The BioCycle Study. J Clin Endocrinol Metab. 2010;95(12):5435-5442. doi:10.1210/jc.2010-0702
- Schieren A, Koch S, Pecht T, Simon MC. Impact of Physiological Fluctuations of Sex Hormones During the Menstrual Cycle on Glucose Metabolism and the Gut Microbiota. Exp Clin Endocrinol Diabetes. 2024;132(5):267-278. doi:10.1055/a-2273-5602
Related Reading
How Wearables Detect Your Cycle: The Tech Explained
The same baseline-and-deviation logic behind temperature and HRV tracking, and how devices read your cycle without measuring a hormone directly.
Luteal Phase: Why You Feel Awful Before Your Period
The phase after ovulation where progesterone drives most of the shifts covered on this page.
How to Tell If You're Ovulating (and Why Your App and Tests Disagree)
What temperature, LH tests, and cervical mucus each pick up around ovulation, and where they disagree.
Apple Watch vs Oura vs Garmin: Which Wins for Cycle Tracking?
How the major wearables handle cycle-related data, and which one fits your setup.