Apple Watch vs Oura vs Garmin: Which Wins for Cycle Tracking?
Your fitness tracker already shows how your body changes throughout your cycle. Here's what those patterns mean—and how to use them for better training, recovery, and cycle awareness.
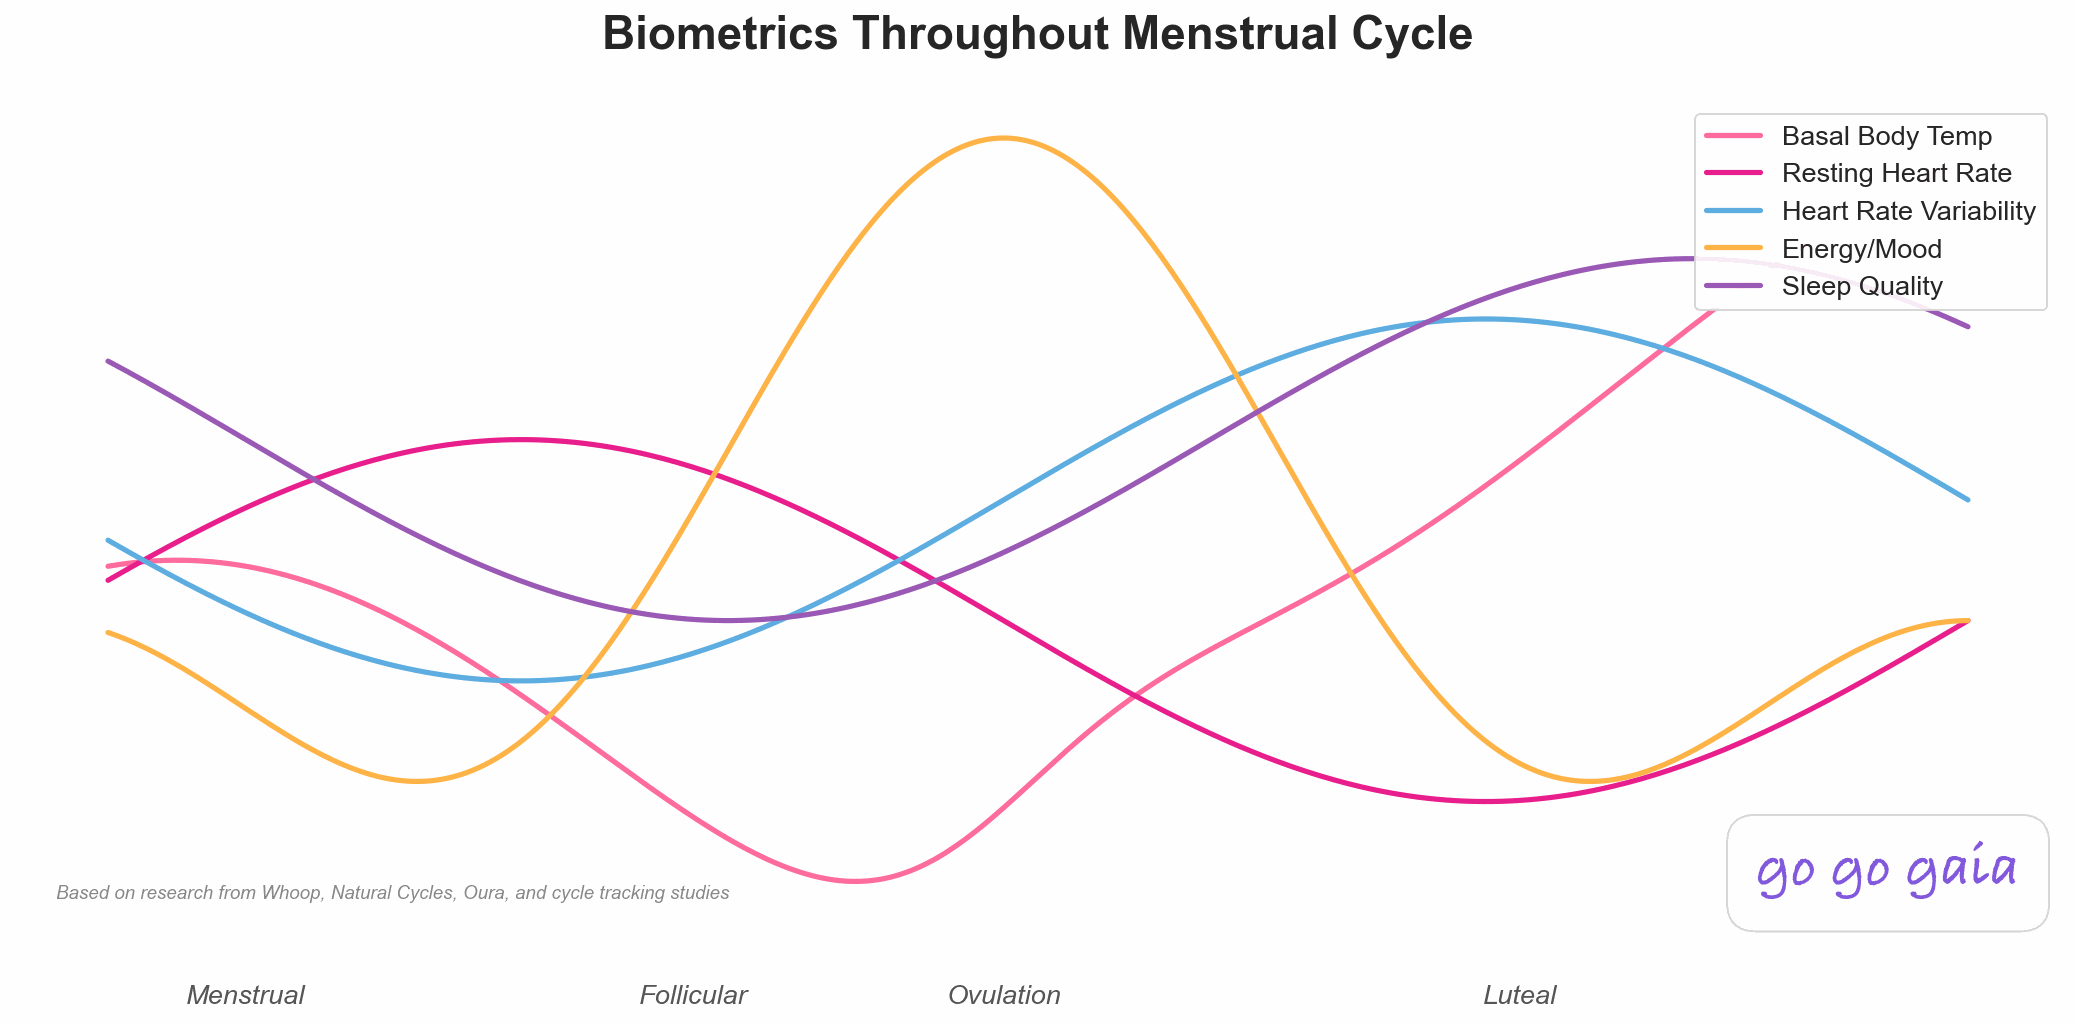
How measurable biometrics change throughout your menstrual cycle
Educational content, not medical advice. For personal concerns, please consult your doctor.
Quick Answer: Which Wearable Wins for Cycle Tracking?
Oura Ring is the strongest pick for cycle tracking specifically: it measures overnight temperature and HRV — the two metrics that shift most reliably across the cycle — and predicts periods from temperature patterns. Apple Watch (Series 8+) is the best fit if you're already in the Apple ecosystem, with overnight wrist temperature and retrospective ovulation estimates. Garmin suits endurance athletes who want built-in cycle tracking next to training load, and Whoop has the deepest recovery data but no temperature sensing and no built-in cycle features.
Whichever you wear, the wearable only sees physiology — pair it with a cycle app for symptoms and context. The comparison table below shows what each device measures.
You wake up to your Oura Ring report: "Your HRV is lower than usual. Consider a rest day." But it's Wednesday, and you're two weeks out from your period. This isn't random. Your body temperature is up. Your resting heart rate is higher. Your recovery score dropped.
You're in your luteal phase. And your wearable has been tracking it all along.
Most fitness trackers measure heart rate variability (HRV), resting heart rate (RHR), and body temperature. These aren't just workout metrics. They're cycle metrics. They change predictably throughout your menstrual cycle because your hormones affect your cardiovascular system, temperature regulation, and recovery capacity.
Here's what's actually happening—and how to use this data without burning out.
What Your Fitness Tracker Measures (And Why It Matters)
Heart Rate Variability (HRV)
HRV measures the time variation between heartbeats. Higher HRV means better recovery and stress resilience. Lower HRV indicates physiological stress or reduced recovery capacity.
What happens during your cycle:
- Follicular phase (Days 1-14): HRV is highest. Your body recovers better from workouts and stress.
- Ovulation (Days 14-16): HRV remains relatively high.
- Luteal phase (Days 17-28): HRV drops. Your body is under more physiological stress from elevated progesterone and higher body temperature.
Why: Progesterone increases body temperature and metabolic rate. Your cardiovascular system works harder, which shows up as lower HRV. This doesn't mean you're unhealthy. It means you're in the second half of your cycle.
What This Means for Training: That "low recovery" score during your luteal phase isn't telling you to skip workouts entirely. It's telling you to adjust intensity. Swap HIIT for moderate cardio. Lift lighter. Add an extra rest day.
Resting Heart Rate (RHR)
Your RHR is the number of times your heart beats per minute when you're at rest. Lower is generally better for cardiovascular fitness, but it naturally fluctuates throughout your cycle.
What happens during your cycle:
- Menstrual phase (Days 1-5): RHR is lowest.
- Follicular phase (Days 6-14): RHR stays relatively low.
- Ovulation (Days 14-16): RHR starts to increase.
- Luteal phase (Days 17-28): RHR peaks, typically 2-5 bpm higher than your follicular baseline.
Why: Progesterone increases your metabolic rate and body temperature. Your heart works harder to circulate blood and regulate temperature, so your resting heart rate goes up. This is completely normal.
Basal Body Temperature (BBT)
BBT is your body's lowest resting temperature, measured first thing in the morning. It's the classic fertility tracking method, and many wearables now track it automatically.
What happens during your cycle:
- Follicular phase (Days 1-14): Temperature is lower, around 97.0-97.5°F (36.1-36.4°C).
- Ovulation (Day 14): Temperature drops slightly right before ovulation, then rises sharply.
- Luteal phase (Days 15-28): Temperature stays elevated, about 0.5-1°F (0.3-0.6°C) higher than follicular phase.
- Just before your period: Temperature drops as progesterone declines.
Why: Progesterone is thermogenic. It raises your body temperature after ovulation and keeps it elevated throughout the luteal phase. This biphasic pattern (two distinct temperature phases) is how fertility trackers identify ovulation.
For Fertility Tracking: Temperature only confirms ovulation after it's already happened (when you see the rise). To catch your fertile window, you need to track other signs like cervical mucus or use ovulation predictor kits.
What Your Data Is Actually Telling You
You're not failing at fitness when your recovery score tanks during week 3 of your cycle. You're just luteal.
Normal Patterns vs. Red Flags
Normal (cyclical patterns):
- HRV drops 5-20% during luteal phase compared to follicular phase
- RHR increases 2-5 bpm after ovulation
- Temperature rises 0.5-1°F after ovulation
- Sleep quality decreases slightly in late luteal phase[1]
- These patterns repeat every month within a regular cycle (21-35 days)[2]
Potential red flags (talk to your doctor):
- Consistently high RHR (10+ bpm above your baseline) that doesn't correlate with your cycle
- No temperature shift after ovulation for several cycles (possible anovulation)
- Temperature stays elevated past expected period (possible pregnancy or other issue)
- Dramatic HRV changes that don't match your cycle pattern
- Severe sleep disruption every month during luteal phase
The key word is pattern. One weird day doesn't mean anything. Weird data that repeats the same way every month at the same point in your cycle? That's your body talking.
How to Actually Use This Data
1. Stop Fighting Your Luteal Phase
Your Whoop tells you you're in the red. Your Oura says "rest." You ignore it because your training plan says "leg day."
Here's the thing: lower HRV and higher RHR during your luteal phase don't mean you're overtraining. They mean you need to adjust. Not skip workouts. Adjust them.
During follicular phase (good HRV, low RHR):
- Push your PR attempts
- Schedule high-intensity intervals
- Try new, challenging workouts
- You recover faster, so you can train harder[3]
During luteal phase (lower HRV, higher RHR):
- Maintain, don't push for new PRs
- Lower intensity or volume (not both if possible)
- Prioritize technique over weight
- Add yoga or walking on days you'd normally do HIIT
This isn't "going easy." It's working with your physiology instead of ignoring it.
2. Track Patterns, Not Individual Days
One day of bad HRV could be:
- Poor sleep
- Alcohol
- Stress at work
- Coming down with a cold
- Late dinner
- Or nothing—just normal variation
But if your HRV drops every month around day 18-20? That's your luteal phase. You can plan for it.
Look at your data over 2-3 months. Do you see the same pattern? Does your RHR always increase after ovulation? Does your temperature shift around the same day each cycle?
That's your pattern. Use it.
3. Use Temperature for Fertility Tracking
If you're trying to conceive or using fertility awareness methods, temperature tracking is useful. But you need consistency:
- Measure at the same time every morning before getting out of bed
- Track for at least 2-3 cycles to see your pattern
- Look for the temperature shift (0.5-1°F rise) that confirms ovulation
- Combine with other signs (cervical mucus, LH tests) for better accuracy
Wearables like Oura and Apple Watch can track temperature overnight, which can be more consistent than manual BBT tracking. But they're not FDA-approved for birth control.
4. Connect the Dots with Symptoms
Your wearable shows your RHR spiked. Is this also when:
- You feel more tired?
- You're craving carbs?
- Your sleep quality drops?[1]
- You're more anxious or irritable?[4]
That's progesterone. All of those things correlate with the luteal phase.[1][2]
When you see the biometric changes alongside your symptoms, you stop blaming yourself for "lacking discipline" and start recognizing patterns. Maybe you're not "randomly" exhausted. Maybe it's day 23 of your cycle, and your body is working harder than usual. Changes in insulin sensitivity, sleep quality, and neurotransmitter levels all shift across your cycle—these aren't "in your head."[1][3][4]
Best Wearables for Cycle Tracking
Not all wearables track the same metrics. Here's what the popular ones measure:
| Wearable | Temperature | HRV depth | Built-in cycle tracking | Subscription | Best for |
|---|---|---|---|---|---|
| Oura Ring | Yes (overnight body temp) | Detailed | Period prediction from temperature | Yes (membership) | Recovery + sleep data without a watch |
| Apple Watch (Series 8+) | Yes (overnight wrist temp) | Basic | Period predictions + retrospective ovulation estimates | No | Apple ecosystem users |
| Garmin | No | Some models | Period + fertility tracking in Connect | No | Endurance athletes |
| Whoop | No | Detailed | None built-in | Yes | Athletes focused on recovery/strain |
Oura Ring
Tracks: HRV, RHR, body temperature, sleep quality, readiness score
Cycle features: Predicts period based on temperature patterns. Shows temperature trends throughout your cycle.
Best for: People who want detailed recovery data without wearing a watch. Great for sleep tracking.
Limitation: Doesn't track workouts as accurately as wrist-based trackers.
Apple Watch (Series 8+)
Tracks: RHR, wrist temperature (overnight), cycle predictions, workout metrics
Cycle features: Retrospective ovulation estimates using temperature. Period and fertile window predictions.
Best for: People already in the Apple ecosystem who want basic cycle tracking alongside fitness tracking.
Limitation: Doesn't measure HRV as comprehensively as Oura or Whoop.
Whoop
Tracks: HRV, RHR, sleep quality, strain, recovery score
Cycle features: None built-in, but the recovery and strain data clearly show cyclical patterns if you track your period separately.
Best for: Athletes who want detailed recovery metrics and don't mind manually tracking their cycle alongside.
Limitation: No temperature tracking. Requires a subscription.
Garmin Fitness Trackers
Tracks: RHR, HRV (on some models), sleep, workout metrics, menstrual cycle tracking
Cycle features: Built-in period and fertility tracking. Shows how training load affects your cycle.
Best for: Endurance athletes who want comprehensive training metrics and cycle awareness.
Limitation: No body temperature tracking (yet).
The Best Approach: Connect your wearable directly to Go Go Gaia.
Go Go Gaia links with Apple Watch, Oura Ring, and Garmin to pull in your biometric data automatically. Then it shows you how your HRV, temperature, and heart rate correlate with your cycle phases, symptoms, and habits—all in one dashboard. You get the what (from your wearable) and the why (from your cycle) in the same place.
How to Integrate Wearable Data with Cycle Tracking
Your Oura Ring isn't talking to your period tracker. Your Whoop doesn't know you're on day 22 of your cycle. Most apps make you choose: track biometrics in one app, cycle in another, and manually connect the dots yourself.
Go Go Gaia solves this by connecting directly to your wearables.
Direct Wearable Integration
Go Go Gaia links with:
- Apple Watch (pulls heart rate, temperature, activity data)
- Oura Ring (HRV, RHR, sleep, temperature trends)
- Garmin (heart rate, activity, sleep)
- MyFitnessPal (nutrition data)
Once connected, your wearable data automatically flows into the app alongside your cycle tracking, symptoms, and habits. No screenshots. No manual entry. No switching between apps.
See Everything in Context
When your Oura Ring shows low HRV on day 21, Go Go Gaia shows you:
- You're in your luteal phase (when HRV naturally drops)
- This is day 21 of your cycle
- Your sleep quality also dropped this week
- You logged PMS symptoms yesterday
- Last cycle, the same thing happened on day 20
Instead of wondering "Why is my recovery bad?", you see: "It's my luteal phase. This happens every month. I should adjust my workout."
Auto-Correlation Insights
Go Go Gaia's correlation engine automatically finds patterns:
- "Your HRV drops by 15% during days 18-25 of your cycle"
- "Your resting heart rate increases 3 bpm after ovulation"
- "You sleep 45 minutes less during your luteal phase"
- "Taking magnesium improves your sleep quality by 20% during PMS"
The app tracks 200+ metrics and shows you which biometrics correlate with which cycle phases, symptoms, and habits. You don't have to manually compare spreadsheets or guess at patterns.
Ask Questions, Get Answers
Type "Why is my HRV low this week?" or "What affects my sleep during my cycle?" into the app's AI assistant. It analyzes your wearable data, cycle history, and logged habits to give you personalized answers—not generic blog advice.
Your fitness tracker collects the data. Go Go Gaia helps you understand what it means.
What About Irregular Cycles?
If your cycles are irregular, biometric tracking becomes even more valuable. You might not know exactly when you'll ovulate, but your body temperature will tell you when it happened. Your RHR will increase after ovulation, even if it's on day 18 one month and day 24 the next.
Track these markers:
- Temperature shift (confirms ovulation happened)
- RHR increase (usually coincides with ovulation)
- Changes in HRV (helps you adjust training even if timing varies)
Ovulatory vs. Anovulatory Cycles: What Your Wearable Shows
If you never see a temperature shift or your biometrics don't follow a cyclical pattern, you might be having anovulatory cycles—cycles where you don't ovulate. This is common with PCOS, perimenopause, stress, or hormonal imbalances.
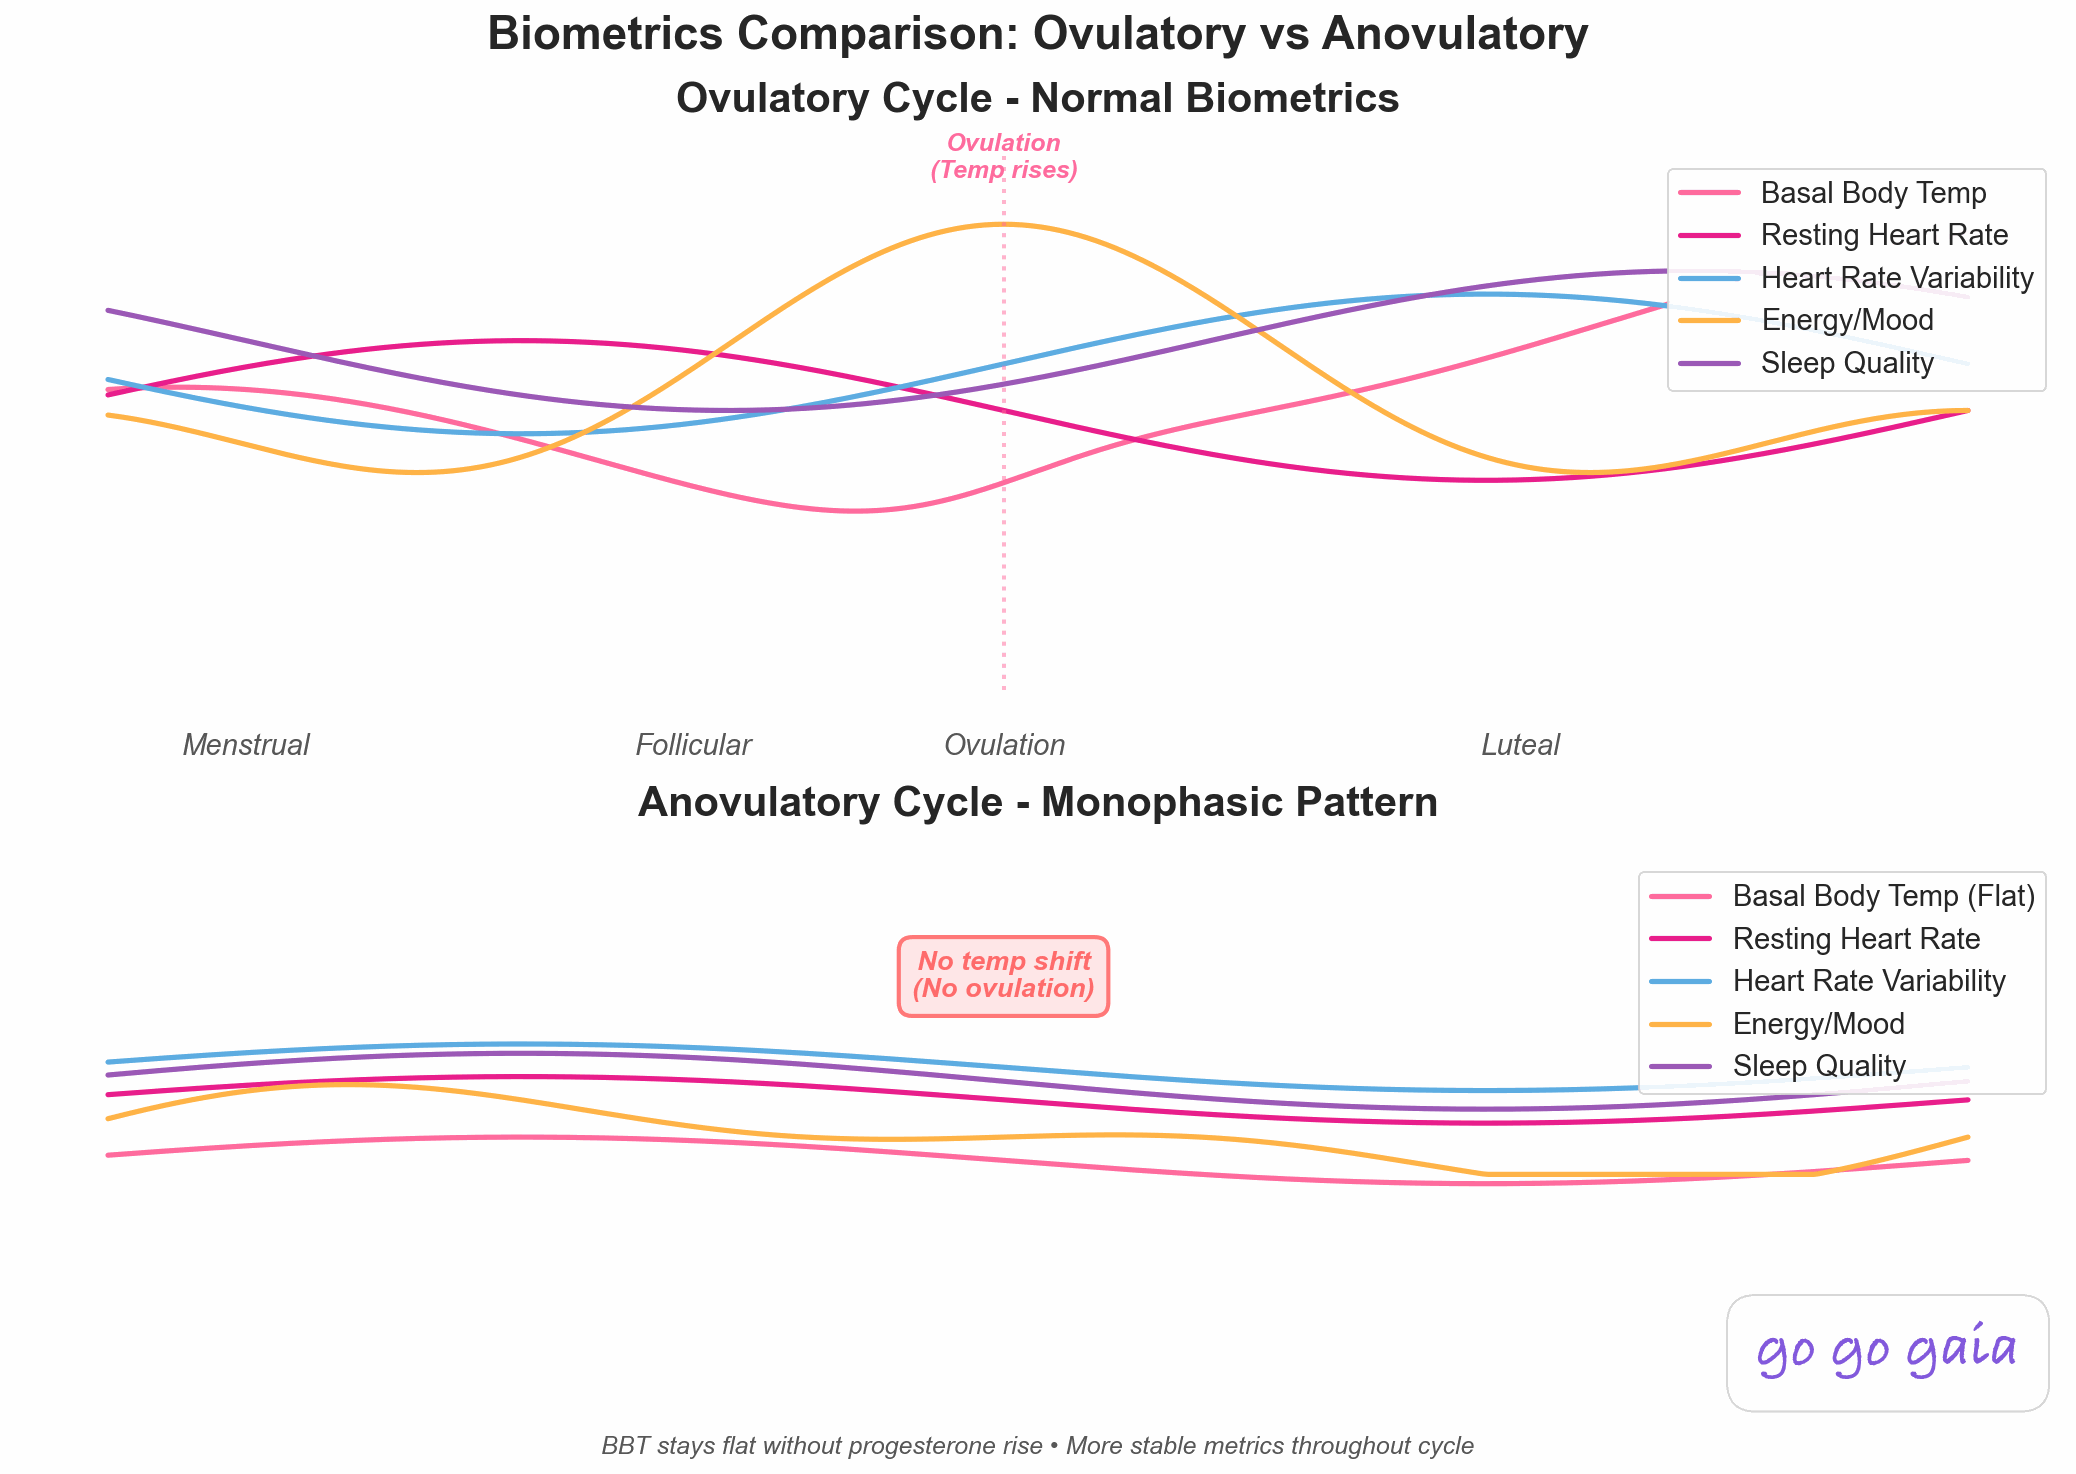
Ovulatory cycles show clear biometric patterns; anovulatory cycles stay flat
Ovulatory cycle (top panel):
- Temperature: Shows biphasic pattern—rises 0.5-1°F after ovulation and stays elevated
- RHR: Increases 2-5 bpm after ovulation
- HRV: Drops during luteal phase
- Energy/Sleep: Clear cyclical changes throughout the month
Anovulatory cycle (bottom panel):
- Temperature: Stays flat—no temperature rise (monophasic pattern)
- RHR: No significant increase mid-cycle
- HRV: May fluctuate but doesn't follow predictable pattern
- Energy/Sleep: Less predictable, may feel erratic
Why this matters:
Your Oura Ring or Apple Watch can tell you if you're ovulating, even before symptoms appear. If you consistently see flat temperature patterns for several months:
- Talk to your doctor—anovulation can indicate PCOS, thyroid issues, or other hormonal imbalances
- You can't get pregnant without ovulation, so this is important for fertility tracking
- Anovulatory cycles often feel different—less predictable PMS, irregular periods, erratic energy
Your wearable gives you objective data to bring to your doctor instead of vague descriptions like "my cycle feels off."
The Bottom Line
Your fitness tracker is already tracking your cycle. You're just not reading it that way.
That "low recovery" score isn't random. Your RHR isn't creeping up because you're out of shape. Your HRV isn't dropping because you're overtraining. Your body temperature isn't higher because you're sick.
You're in your luteal phase. And once you see the pattern, you can stop fighting it and start using it.
Use the data to:
- Adjust training intensity based on your cycle phase, not arbitrary weekly plans
- Recognize when symptoms are hormonal, not willpower failures
- Track ovulation for fertility awareness
- Identify what's cyclical vs. what might need medical attention
Your wearable shows you what's happening. Cycle tracking shows you why. Combine them, and you stop guessing.
Connect Your Wearable to Go Go Gaia
Your Oura Ring or Apple Watch collects the data. Go Go Gaia shows you what it means in context with your cycle.
What makes Go Go Gaia different:
- Direct wearable integration: Connect Apple Watch, Oura Ring, or Garmin to automatically import HRV, temperature, heart rate, and sleep data
- Unified dashboard: See your biometrics, cycle phase, symptoms, and habits all in one place
- Auto-correlation insights: The app finds patterns you'd miss—like how your HRV drops every month during your luteal phase, or which habits improve your recovery
- Context for your metrics: When your recovery score drops, see exactly where you are in your cycle and why it's happening
- Training optimization: Plan workouts based on your actual biometric patterns, not generic weekly schedules
- AI-powered answers: Ask "Why is my HRV low?" and get personalized insights based on your data
Stop switching between your wearable app and your period tracker. Connect your fitness tracker to Go Go Gaia and see the full picture.
Connect your Apple Watch, Oura Ring, or Garmin and see how your biometrics map to your cycle
References
- Rugvedh P, Gundreddy P, Wandile B. The Menstrual Cycle's Influence on Sleep Duration and Cardiovascular Health: A Comprehensive Review. Cureus. 2023;15(10):e47292. doi:10.7759/cureus.47292
- Avila-Varela DS, Hidalgo-Lopez E, Dagnino PC, et al. Whole-brain dynamics across the menstrual cycle: the role of hormonal fluctuations and age in healthy women. npj Women's Health. 2024;2:8. doi:10.1038/s44294-024-00012-4
- Hummel J, Benkendorff C, Fritsche L, et al. Brain insulin action on peripheral insulin sensitivity in women depends on menstrual cycle phase. Nat Metab. 2023;5:1475-1482. doi:10.1038/s42255-023-00869-w
- Bendis PC, Zimmerman S, Onisiforou A, Zanos P, Georgiou P. The impact of estradiol on serotonin, glutamate, and dopamine systems. Front Neurosci. 2024;18:1348551. doi:10.3389/fnins.2024.1348551
Related Reading
Complete Guide to Cycle Syncing
Learn how to align your workouts, nutrition, and lifestyle with your menstrual cycle.
Best Period Tracker App 2026: Clue vs Flo vs Ovia Compared
What to track during your cycle and how to use your data to understand your body.
Best Ovulation Tracker App 2026: 6 Apps Compared
Learn to recognize ovulation signs including temperature shifts and physical symptoms.
How to Build Habits That Actually Stick
The most effective tracking methods and how cycle awareness improves results.
Cycle Syncing Made Easy: Why Apps Beat Spreadsheets
How to use technology for cycle syncing instead of manual spreadsheets and notebooks.