HRV and Resting Heart Rate Across Your Cycle
Two numbers on your wearable move in opposite directions every cycle: heart rate variability trends down, resting heart rate trends up. Here's what's actually driving that, how much it typically shifts, and why one weird night doesn't mean anything's wrong.
Quick Answer: HRV and Resting Heart Rate Across Your Cycle
Heart rate variability (HRV) tends to run lower in the luteal phase than the follicular phase, and resting heart rate (RHR) tends to run higher, typically by somewhere around 1 to 5 beats per minute. Both trace back to the same hormone: progesterone, which rises after ovulation and shifts your autonomic nervous system toward its more activated, sympathetic side.[1]
This is a population-average pattern, not a daily verdict. A single lower-than-usual HRV reading or a slightly faster pulse on one night doesn't mean something is wrong. Sleep, alcohol, travel, and stress move both numbers more than cycle phase does on any given night. Oura, Whoop, Apple Watch, and Garmin all measure both metrics, using the same overnight sensor approach with different hardware. Since sleep is such a large confound here, it's worth seeing how period trackers that also track sleep stack up if you want that data in the same place as your cycle.
Educational content based on published research, not medical advice. For personal or fertility concerns, please consult your doctor.
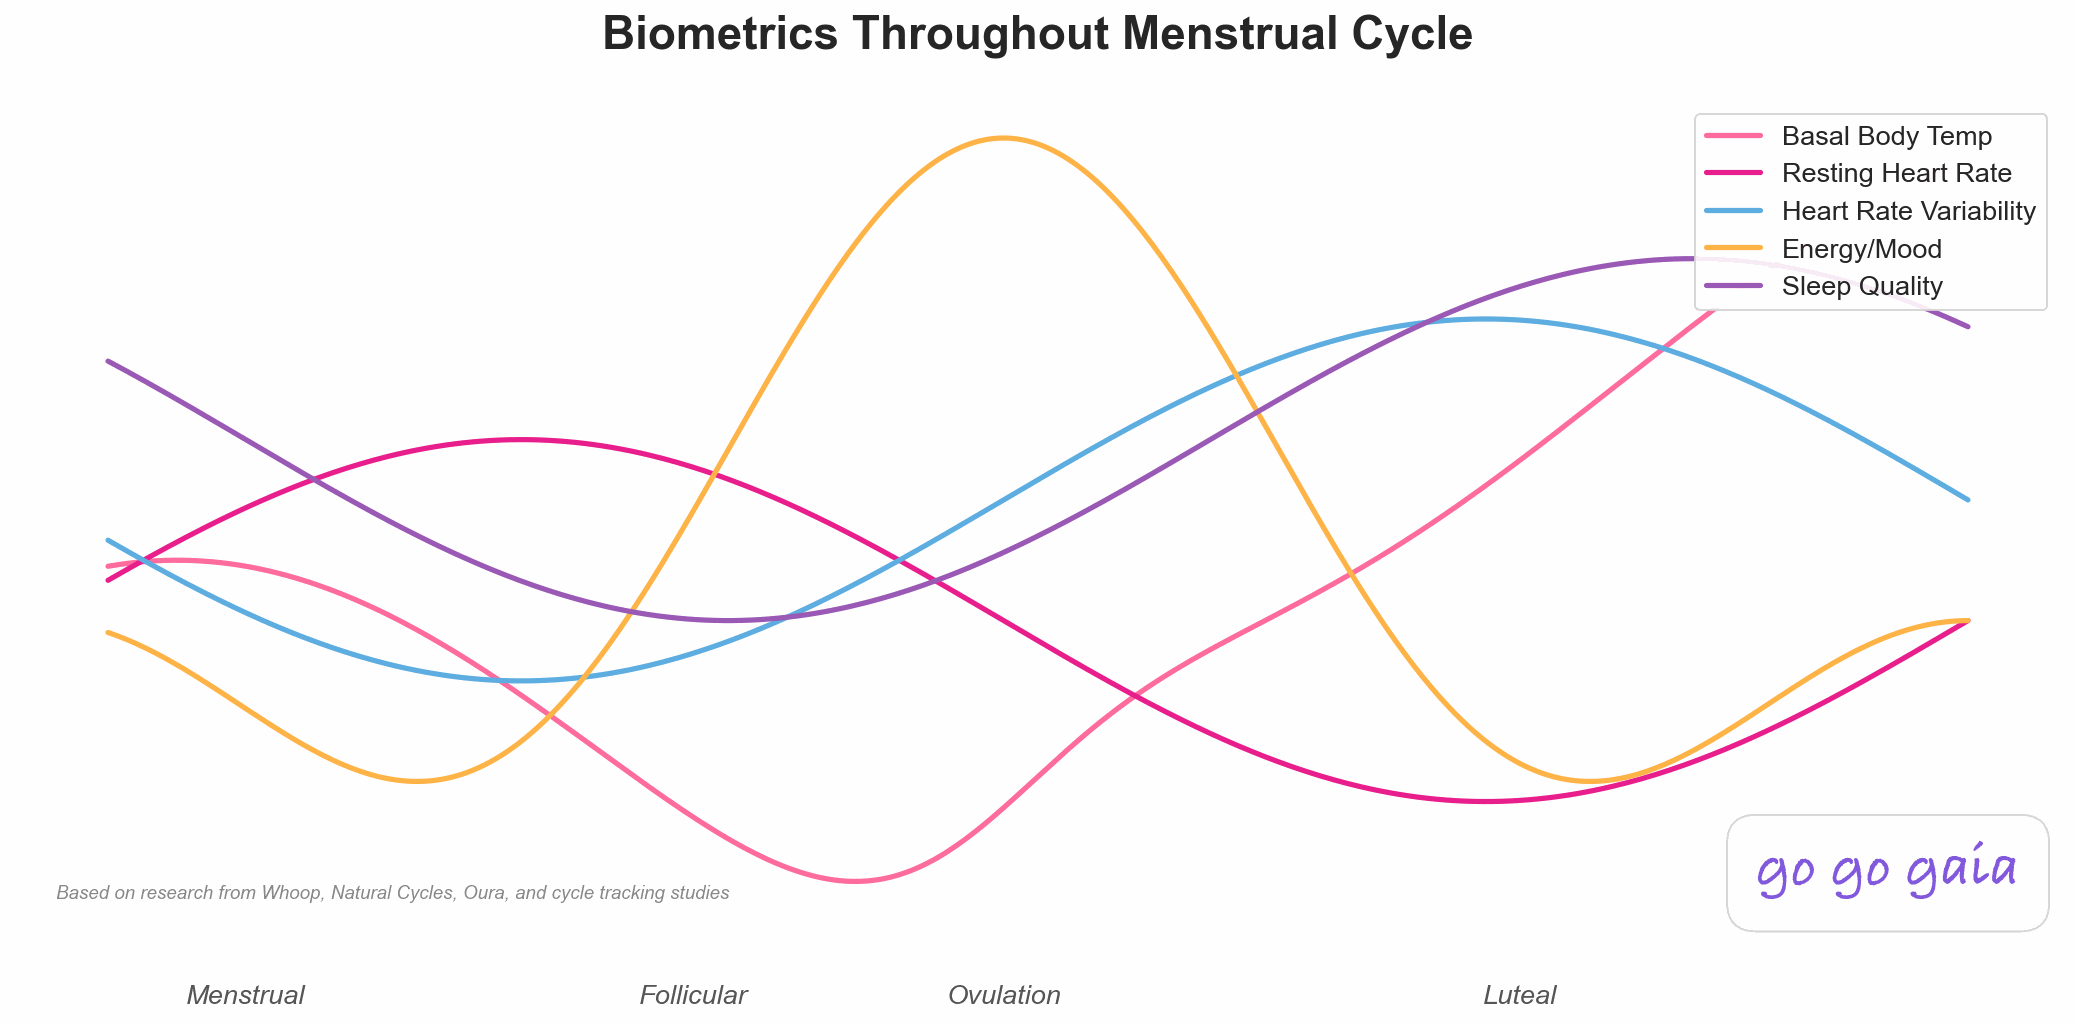
The two cardiac signals a wearable reads every night. Both shift with progesterone, in opposite directions.
Search "HRV menstrual cycle" and you'll land on a post from Oura, one from Whoop, and one from Clue, each explaining the same pattern through the lens of their own product. The pattern itself is genuinely well studied, probably the best-evidenced biometric shift tied to the cycle. The crowded part isn't the science. It's the branding wrapped around it.
This page skips the product pitch and goes straight to what the research shows: what HRV and resting heart rate actually measure, how each one moves across a typical cycle, and how that pattern holds up in a dataset of tens of thousands of real cycles instead of just a small lab sample.
If you want to understand how a ring or watch turns signals like these into a cycle-phase estimate in the first place, that's a separate question, covered in our piece on how wearables detect your cycle. This page stays on the signals themselves: what they are, why they move, and what the movement does and doesn't tell you.
What HRV and Resting Heart Rate Actually Measure
Resting heart rate is the simplest of the two. It's how many times your heart beats per minute while you're still and relaxed, usually measured overnight during sleep. A lower resting heart rate generally reflects a heart that's working less to do the same job.
Heart rate variability is less intuitive. Your heart doesn't beat like a metronome. The gap between one beat and the next varies by tiny fractions of a second, and HRV measures how much that gap changes over time. A higher HRV usually means your parasympathetic nervous system, the "rest and digest" branch, has more influence over your heart rhythm in that moment. A lower HRV usually means the sympathetic, "fight or flight" branch has more control.
The research on cycle-related HRV changes specifically calls out vagally-mediated HRV, meaning the part of the signal driven by the vagus nerve, the main channel for parasympathetic activity.[1] Researchers usually measure this with time-domain metrics like RMSSD and SDNN, both of which look at how much the beat-to-beat gaps bounce around. These aren't identical measures. As you'll see below, they don't always move by the same amount, or even in the same direction, across a cycle.
HRV and RHR are related but distinct. Both reflect autonomic nervous system activity, but HRV captures the balance between its two branches, while RHR is closer to a blunt measure of overall cardiac workload. That's why the research treats them as two separate signals worth tracking together, not one number wearing two names.
How Both Shift Across a Cycle
The clearest evidence comes from a pair of within-person studies that tracked the same women across multiple cycles, rather than comparing different women to each other. The researchers found that higher-than-usual progesterone reliably predicted lower-than-usual HRV in the same person, with a medium effect size for the drop between the follicular and mid-luteal phases. Estrogen showed no meaningful effect on its own. Progesterone was the driver.[1]
A 2026 living systematic review, meaning one the authors plan to keep updating as new studies come out, pooled 16 wearable-based studies on this exact question. It found HRV consistently higher at the start of the cycle and lower toward the end, with time-domain differences typically in the range of 3 to 9 percent, though some individual studies found swings as large as 20 percent.[2] That range itself matters: this is a real, replicated pattern, and it's also not a fixed number you should expect to hit exactly.
The largest confirmation of the pattern comes from outside a lab entirely. An analysis of more than 45,000 menstrual cycles across over 11,500 people, drawn from real wearable data, found resting heart rate at its lowest around day 5 of the cycle and its highest around day 26, an average swing of about 2.7 beats per minute. HRV followed the mirror pattern, peaking early and dipping late in the cycle by an average of roughly 4.6 milliseconds on the RMSSD scale.[3] At that scale, the pattern isn't a lab curiosity. It shows up in ordinary people wearing ordinary devices.
Smaller studies add texture to the same story. An observational study of 193 women wearing a wrist sensor found resting pulse, respiratory rate, and HRV all elevated together in the luteal phase.[4] One of the earliest consumer-wearable demonstrations, a Clue pilot study using Fitbit data from a small group of participants, found resting heart rate significantly higher in the ovulatory and luteal phases than during menstruation and the early follicular phase, mirroring the same temperature-linked pattern researchers already knew from basal body temperature charting.[5] And a lab study measuring several HRV parameters side by side found that two time-domain measures, SDNN and SDANN, dropped significantly in the luteal phase, while two others, RMSSD and pNN50, showed no significant change at all.[6] Not every HRV metric moves by the same amount. The overall direction is consistent. The specific numbers depend on which measure you're looking at.
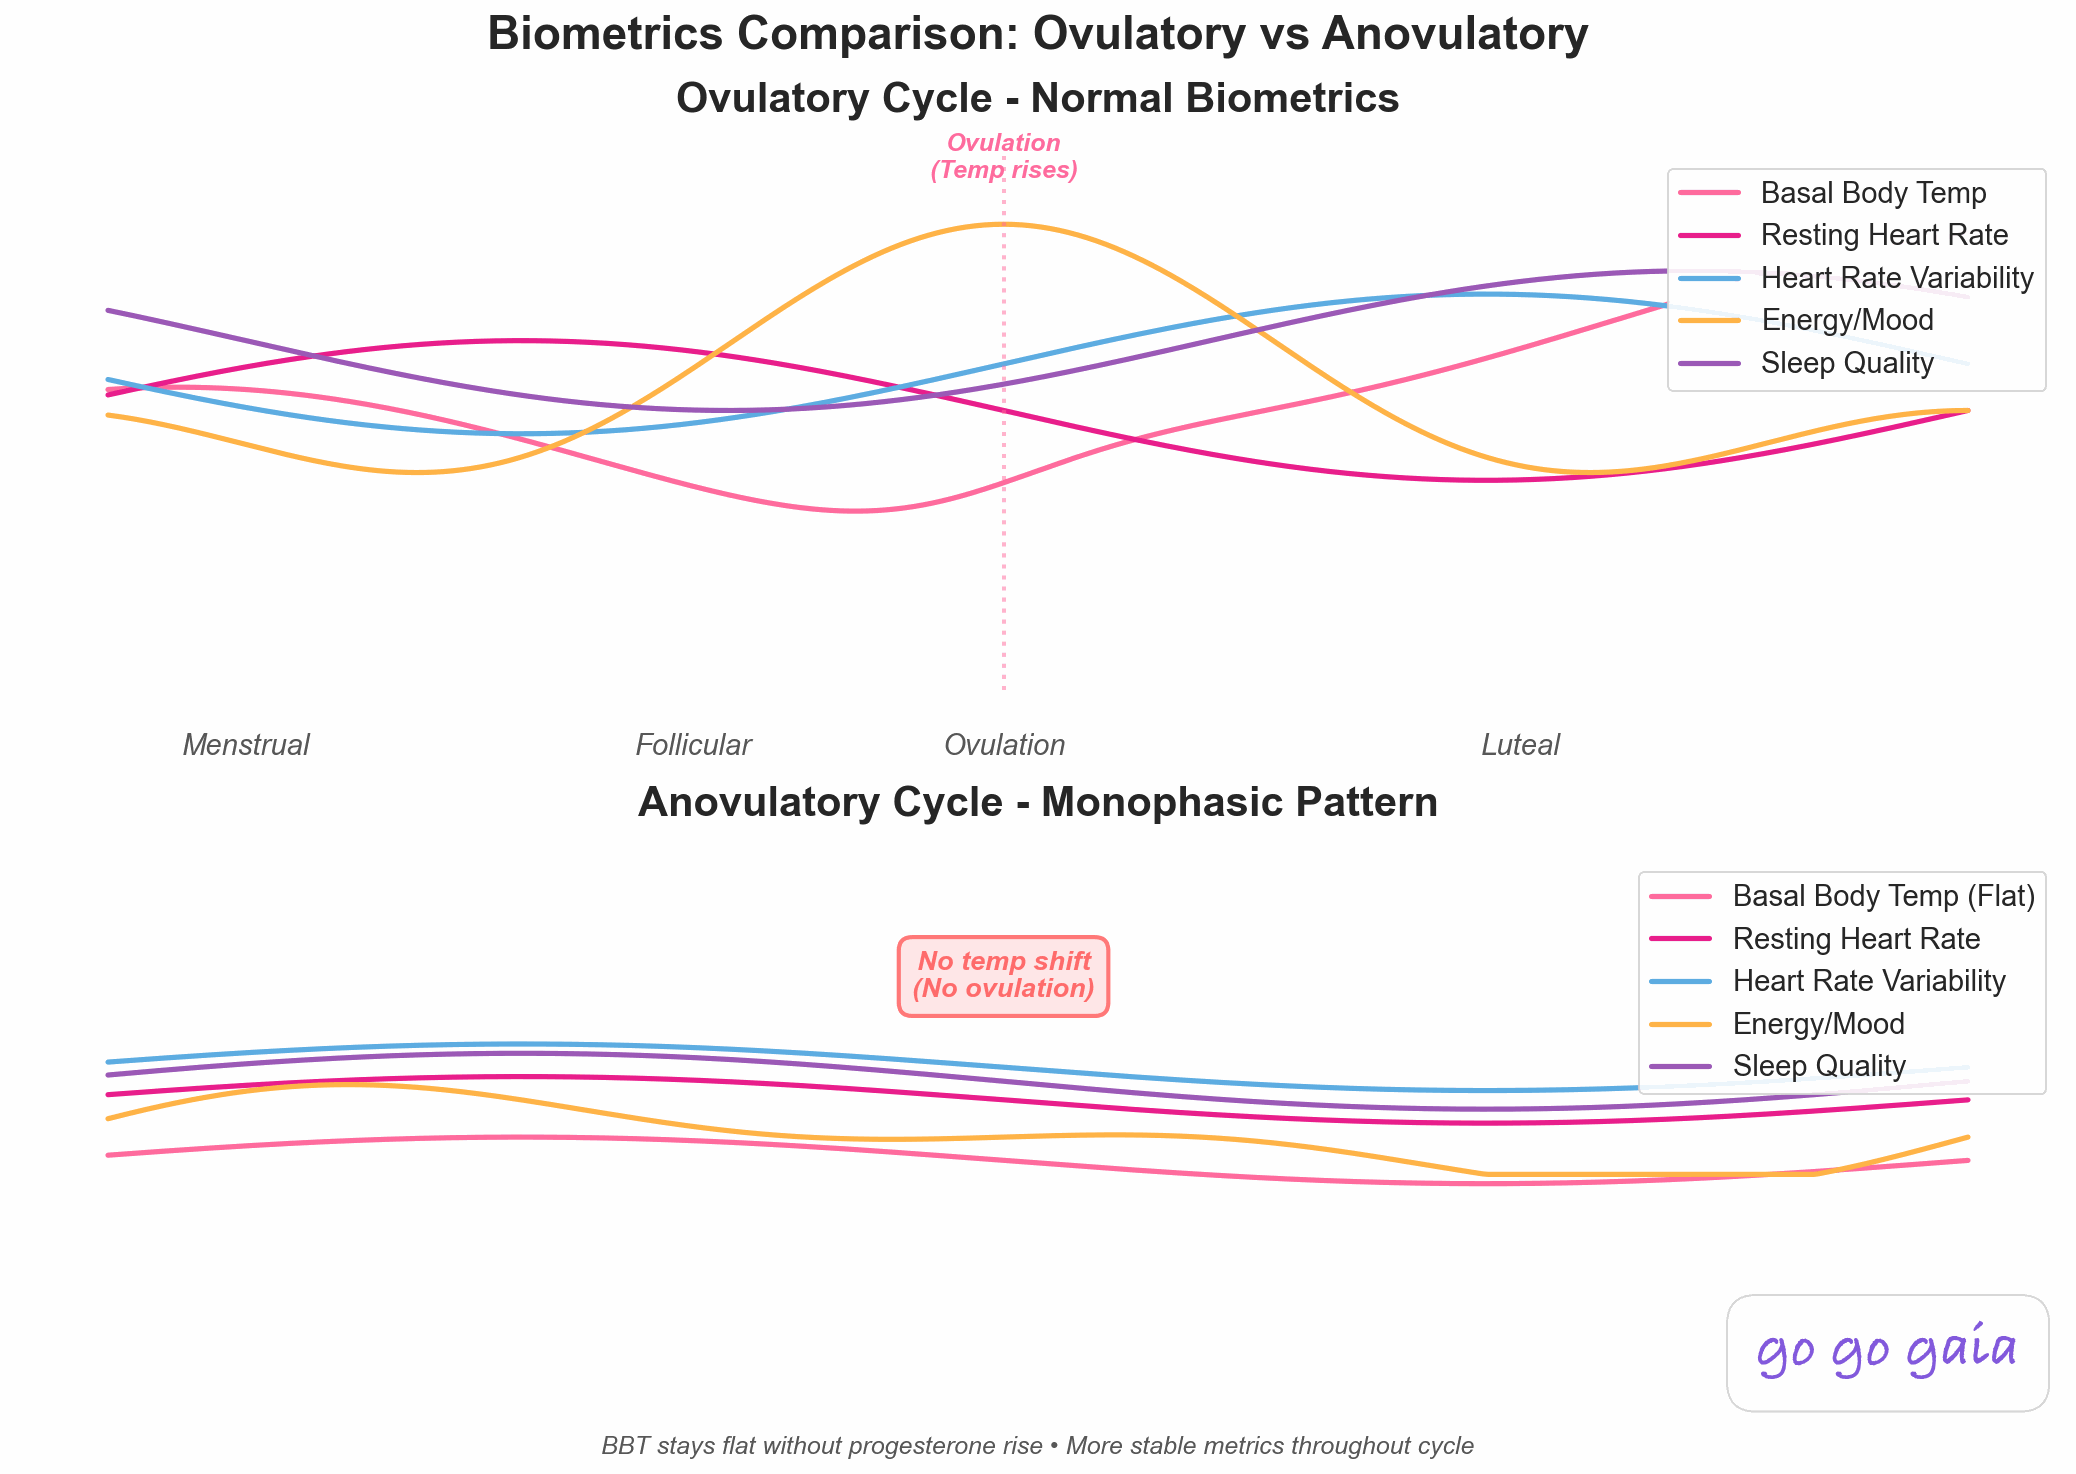
Because the driver is post-ovulation progesterone, the pattern only shows up in cycles where ovulation actually happens. A cycle without ovulation stays flat.
How This Shows Up on Oura, Whoop, Apple Watch, and Garmin
The devices are all reading the same kind of signal with different hardware. Each one uses a light-based pulse sensor, at the finger for Oura, at the wrist for the others, to track your heartbeat overnight during sleep, then builds a personal baseline for HRV and resting heart rate over your first week or two of wear. From there, it watches for a sustained move away from that baseline, the same baseline-and-deviation approach we cover in more depth in how wearables detect your cycle.
What each company does with the raw numbers differs. Oura folds HRV and resting heart rate into its nightly Readiness contributors. Whoop feeds both directly into its Recovery score. Apple Watch shows overnight HRV and resting heart rate as their own trend lines in the Health app, without combining them into a single score. Garmin surfaces HRV Status and resting heart rate as separate widgets on its side. None of that changes the underlying biology described above. It just changes how the number gets packaged and labeled before it reaches your screen. If you're an Oura user, our breakdown of Oura's Cycle Insights and Readiness scores walks through exactly how the ring turns these same HRV and heart rate signals into that score.
If you're weighing which device to buy based on how it handles cycle-linked data, that comparison lives in our Apple Watch vs Oura vs Garmin piece. Veya doesn't run its own sensor or its own HRV algorithm. It connects to your existing Apple Watch, Oura, Garmin, or Whoop account and pulls in the HRV and resting heart rate numbers the device already calculated, so you can see them next to the cycle day and symptoms you log by hand. Our cycle syncing features page covers what that phase-tagged view looks like in practice. If your HRV data lives in one app and your labs or CGM readings live in another, here's how apps handle pulling all of that together.
One reading doesn't mean anything's wrong. Everything above describes an average pattern across groups of people and many cycles, not a rule for any single night. Sleep quality, alcohol, travel, illness, heat, and ordinary stress all move HRV and resting heart rate more than cycle phase does on a given night. Even the authors of the 2026 living systematic review make this point directly: longitudinal trends collected under consistent conditions tell you far more than any one isolated reading.[2] A lower HRV number on day 20 doesn't mean something's wrong. It might just be Tuesday.
The Short Version
- HRV tends to run lower in the luteal phase than the follicular phase, an effect tied specifically to rising progesterone, not estrogen.
- RHR tends to run higher in the luteal phase, typically somewhere around 1 to 5 beats per minute above the follicular baseline.
- A 2026 living systematic review puts the average HRV difference at roughly 3 to 9 percent, with individual studies ranging wider.
- A dataset of over 45,000 real-world cycles confirms the same direction at scale: RHR lowest near day 5, highest near day 26.
- Oura, Whoop, Apple Watch, and Garmin all measure both signals the same basic way: wrist or finger sensor, personal baseline, nightly averaging.
- None of it works as a single-night signal. Sleep, alcohol, stress, and illness move these numbers more than cycle phase does on any one day.
Two numbers, one hormone, a well-documented pattern. The value isn't in checking either one the morning after a rough night. It's in watching both trend across a full cycle, or a few, and noticing where the shifts line up with everything else you're already tracking.
Frequently Asked Questions
Educational information based on published sources. Not medical advice. For personal concerns, please consult your doctor.
Does HRV really drop during the luteal phase?
Yes, on average. A within-person study tracking two separate cohorts found vagally-mediated HRV was significantly lower in the mid-luteal phase, with a medium effect size, and traced the drop specifically to rising progesterone rather than estrogen. A 2026 living systematic review of 16 wearable-based studies puts the typical time-domain HRV difference between the start and end of the cycle at roughly 3 to 9 percent, though individual studies have found larger swings. It's a consistent population-level pattern, not a fixed number for every person.
Why does resting heart rate go up before your period?
Progesterone is thermogenic, meaning it raises your core body temperature after ovulation, and a warmer body needs a slightly faster heart rate to move blood and shed heat. Progesterone also shifts the balance of your autonomic nervous system toward its more activated, sympathetic side, which nudges resting heart rate up further. Both effects fade once progesterone drops just before your period starts.
How much should I expect my resting heart rate to rise?
Most studies put the luteal-phase rise somewhere between 1 and 5 beats per minute above the follicular-phase baseline. An analysis of over 45,000 real-world cycles from wearable data found an average swing of about 2.7 bpm between the lowest point, around day 5, and the highest point, around day 26. Your own number depends on your baseline fitness, sleep, and countless other day-to-day factors, so treat any range as a rough average, not a target.
Is a lower HRV reading on any single day something to worry about?
No. Cycle phase is one of many things that move HRV and resting heart rate on a given night, and it's usually not the biggest one. Sleep quality, alcohol, travel, illness, heat, and stress all shift these numbers more than cycle phase does on any single night. The research behind this page describes an average pattern across groups of people and many cycles. It isn't a diagnostic signal for one reading on one day.
Do Oura, Whoop, Apple Watch, and Garmin all show the same pattern?
They measure the same underlying signals using the same basic approach: a wrist or finger sensor reads your pulse overnight, and the device builds a personal baseline for HRV and resting heart rate, then tracks deviations from it. So the direction of the shift, lower HRV and higher resting heart rate in the luteal phase, shows up across all of them. The exact numbers differ by device because of sensor placement, sampling rate, and how each company calculates its own scores on top of the raw data.
Does hormonal birth control change this pattern?
The 2026 living systematic review found that people using hormonal contraception tended to have lower overall HRV than naturally cycling people, with the gap most pronounced in the second half of the pill or ring cycle. Because hormonal contraception suppresses ovulation, the specific progesterone-driven luteal-phase pattern described on this page mainly applies to natural, ovulatory cycles.
Can HRV or resting heart rate predict ovulation on their own?
Not reliably on their own. Both shift after ovulation, once progesterone is already rising, so they confirm that ovulation likely happened rather than predicting it in advance. Wearables typically combine them with temperature, which has a more direct hormonal link, for cycle-phase estimates. For the full mechanics of how that detection works, see our companion piece on how wearables detect your cycle.
Your wearable already has these numbers.
HRV and resting heart rate mean more next to the cycle day and symptoms you actually logged. Connect your Apple Watch, Oura, Garmin, or Whoop and see them in one place.
Log One Cycle Alongside Your WearableMost people see their first clear pattern within a single cycle.
References
- Schmalenberger KM, Eisenlohr-Moul TA, Jarczok MN, et al. Menstrual Cycle Changes in Vagally-Mediated Heart Rate Variability are Associated with Progesterone: Evidence from Two Within-Person Studies. J Clin Med. 2020;9(3):617. doi:10.3390/jcm9030617
- de Jager E, Caulfield B, Angelidi E, MacNamee B, Holden S. Wearable-Derived Heart Rate Variability Across the Menstrual Cycle, Hormonal Contraceptive Use, and Reproductive Life Stages in Females: A Living Systematic Review. Sports Med. Published online 2026. doi:10.1007/s40279-025-02388-y
- Jasinski SR, Presby DM, Grosicki GJ, Capodilupo ER, Lee VH. A novel method for quantifying fluctuations in wearable-derived daily cardiovascular parameters across the menstrual cycle. npj Digit Med. 2024. doi:10.1038/s41746-024-01394-0
- Goodale BM, Shilaih M, Falco L, Dammeier F, Hamvas G, Leeners B. Wearable Sensors Reveal Menses-Driven Changes in Physiology and Enable Prediction of the Fertile Window. J Med Internet Res. 2019;21(4):e13404. doi:10.2196/13404
- Friedman K. Resting Heart Rate During the Menstrual Cycle: Clue Pilot Study Results. Helloclue.com, published by BioWink GmbH. Data presented as: Högqvist Tabor V. Resting heart rate changes during the menstrual cycle [poster]. ESHRE Annual Meeting; 2016; Helsinki, Finland. helloclue.com
- Yazar Ş, Yazıcı M. Impact of Menstrual Cycle on Cardiac Autonomic Function Assessed by Heart Rate Variability and Heart Rate Recovery. Med Princ Pract. 2016;25(4):374-377. doi:10.1159/000444322
Related Reading
How Wearables Detect Your Cycle: The Tech Explained
How temperature, HRV, and heart rate get turned into a cycle-phase estimate, and why detection lands a step behind.
Apple Watch vs Oura vs Garmin: Which Wins for Cycle Tracking?
Which wearable to pick, and how to train and recover with the data once you have it.
What Is the Luteal Phase?
The phase after ovulation, where progesterone drives the HRV and heart rate shifts above.
How to Tell If You're Ovulating
The signs of ovulation and what temperature, LH tests, and cervical mucus each tell you.
Best App to Track Sleep and Your Cycle
Resting heart rate is measured overnight during sleep. Here's how 5 apps pair sleep data with your cycle.